
We interrupt our Latin American reporting to bring faithful followers a practical Partout about how we find the weather we want and where we find it.
As anyone who knows us knows, our travels are highly weather-driven. Louis suffers in the cold, Doris wilts in humidity. In retirement, we have solved the heat issue permanently by summering in Sandpoint, where we never experience extremes of heat, humidity or mosquitos. Winter, however, is the annual question.
In Latin America this year, we have done a bang-up job of avoiding winter’s cold, damp and darkness. It has not always been thus.
Sure, a house on the beach like the one above, where we spent a week in Zanzibar last winter, meets Louis’s requirements, but a steady stream of these locations would turn Doris into a molten mess. And, yes, southern Europe is significantly warmer than northern Europe, but how much sunshine does a winter’s day bring? How much rain? And is even southern Europe “warm enough” for cold-averse Louis?

(NOTEWORTHY EXCEPTION: For Louis, it is always springtime in Paris. If he is slurping oysters on a sidewalk, the weather is glorious, regardless of what the thermometer says and what Louis is wearing.)

Weather-and-Climate.com
To improve on our active imaginations and flawed impressions, we go data diving. Fellow weather wimps, this Partout is for you.
Weather-and-Climate.com (WAC) is where we start.

First, we click on the country under investigation. Let’s take a look at Ecuador, since that’s where Partout plans to spend most next winter. Here is what Ecuador’s country page displayed this March 31.

Most of this is about as helpful for weather mapping as a horoscope is for life mapping. Only by clicking on the little “city” link do we get the real weather gold.
For example, we are currently planning to spend most of next winter in Cuenca, Ecuador, passing through Mexico City for a couple weeks either on the way there or back. The temperatures in both cities are mild and stable all winter (i.e., both are “warm enough”) so the question then becomes whether there are other weather conditions that make it smarter to go to one city earlier in the winter than to the other one.
To find out, we scroll down to the annual sunshine charts for the cities, where the plot thickens quickly. The top chart under this paragraph is for Mexico City, the bottom one for Quito (the nearest comparable city to Cuenca).

Whoa! (Doris actually says things like this while weather wonking.)
March turns out to be Mexico City’s sunniest month, with an average of more than 250 hours of bright stuff. December is still sunny, with just under 250 hours on average. Meanwhile, down at the equator in Quito, March is close to the most overcast month of the year, with a little less than 150 hours of average sunshine. Things brighten up considerably for Quito in December, when the average is almost 200 hours.
Comparatively, this means we could experience three hours more sunshine a day in Mexico City in March than we could expect in Quito. Mexico City would still outshine Quito in December but by a great deal less.
With this, our itinerary lurches toward heading straight to Quito/Cuenca in December, returning via Mexico City in March.
But there’s still another variable that can make a huge difference in travel pleasure: Rain. Another big wow awaits in the weather data. Again, Mexico City in the top graph, Quito below.
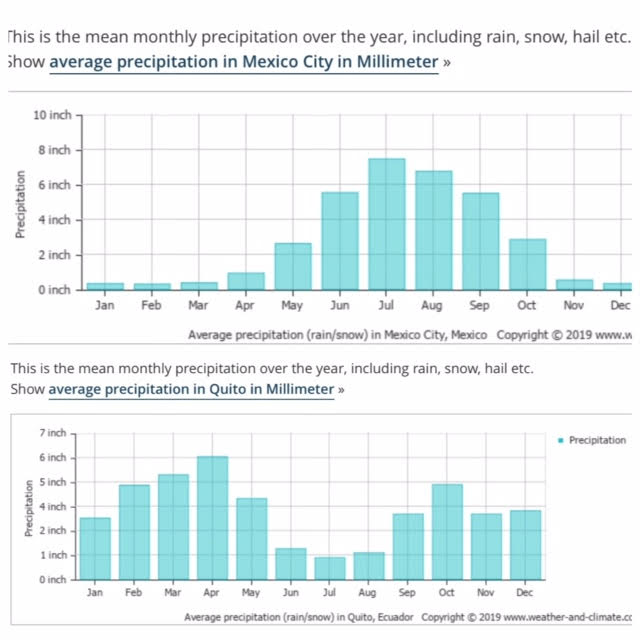
Turns out Mexico is bone dry in both December and March, but March is Quito’s second-wettest month of the whole year. By the metrics most important to us, starting our winter in Ecuador and ending it in Mexico begins to make a whole lot of weather sense.
There is just one hitch. Quito is not our final destination, Cuenca is, and Cuenca is nearly 300 miles south and 1,000 feet lower than Quito. Sadly, WAC has failed us on Cuenca. The site uses weather data from Guayaquil for Cuenca, but Guayaquil is a famously humid beach city whose weather is nothing like Andean Cuenca. We chose Quito for comparison purposes because we know its weather patterns are much closer to Cuenca’s.
Still, a lot of important detail can get lost in “for comparison purposes.” The average height of Louis de Guise and Lebron James is 6 feet 2 inches, but that does not give us a very good picture of what the two guys look like.
A deeper dive is required. For that data, we turn to a mobile device and open our go-to weather forecasting app: Dark Sky.
Dark Sky
 Forgiving Apple its chest-beating (“the most accurate source of hyperlocal weather information” on earth), Dark Sky offers at least three really useful weather forecast metrics that build out the averages we get from WAC: temperature, “feels-like” temperature and precipitation, all by the hour, plus sunrise and sunset times. And, again, another mother lode: “Time Machine.”
Let’s switch continents for this exercise. Our most urgent weather-planning need this very minute is not winter in Ecuador or Mexico City but spring in Marseille, France, where April takes us.
WAC reports Marseille’s average high temp at a smidge under 60 F for the whole month, but what does that mean in terms of packing for a visit that will stretch from the end of March to the beginning of May? This is where Dark Sky’s Time Machine – and being really, really data wonky – comes in.

The Dark Sky forecast for April 17, roughly the midpoint of our visit to Marseille, is for a high of 64 F (four degrees warmer than the historic average).
But if we time travel back to the same date in 2018 with Dark Sky, we find the high was 76F – more than 10 degrees warmer than this April’s forecast and 15 degrees higher than WAC’s historic April average. 
Taking another leap in time to check out 2017 on the same date, we find the temperature not quite as warm as in 2018 but still much higher than the WAC average.

We pack with all this in mind.
Beyond Data
Weather is not everything when it comes to travel planning. Special events and holidays, budgets, fellow-traveler schedules and many other conditions also figure in. Everyone has something like Louis’s oysters in Paris that renders weather irrelevant. It rains year-round in the Netherlands but, as long as the kids live there, we go. (Favorite weather app where they live: Buienradar, helpfully forecasting rain by the minute.)
What’s more, historical weather data appears to be getting less reliable. Everywhere we go, whoever we talk to – whether it is the last ice merchant of Cotopaxi, an indigenous guide in the Amazon or an Uber driver in Bogota – tells us their weather is not what it once was, their temperatures are hotter, their seasons dryer. In the end, all the research under the sun will not unerringly predict what any given sunrise will bring.
All the same, for us, weather comes down to something like the announcement airlines make on flights: “We know you have a choice in airlines. Thanks for choosing (fill in the blank).”
We choose mild temperatures under sunny and dry skies. Doing the data dive to improve the odds of getting them is like searching for the most desirable flight schedule or air fare. It pays off.

FROM THE PARTOUT TOOLBOX:
Whether your reaction to our weather plotting is “This is the best news since sliced bread” or “Get a life!” we could not travel as happily as we do if we left weather entirely to luck. Having located the websites most relevant to our weather goals, useful data is never more than a few clicks away. We also continue to rely on real, live breathing humans for weather insights, especially those humans with preferences and goals similar to our own. Two inches of rain falling between 10 pm and 4 am daily have a vastly different impact on travel comfort and activity than two inches falling between 10 am and 4 pm. Sometimes it takes someone on the ground to turn the averages and histories into useful guidance.
TOP TIP:
Whatever it is that makes your travels happiest, seek out the internet and human resources that best report on what matters most to you on the road. The most robust source in the world is worthless if it doesn’t lead to the results you want.
COMING SOON: Not Adios But Hasta Luego


One thought on “Weather-Wise: A Practical Partout”